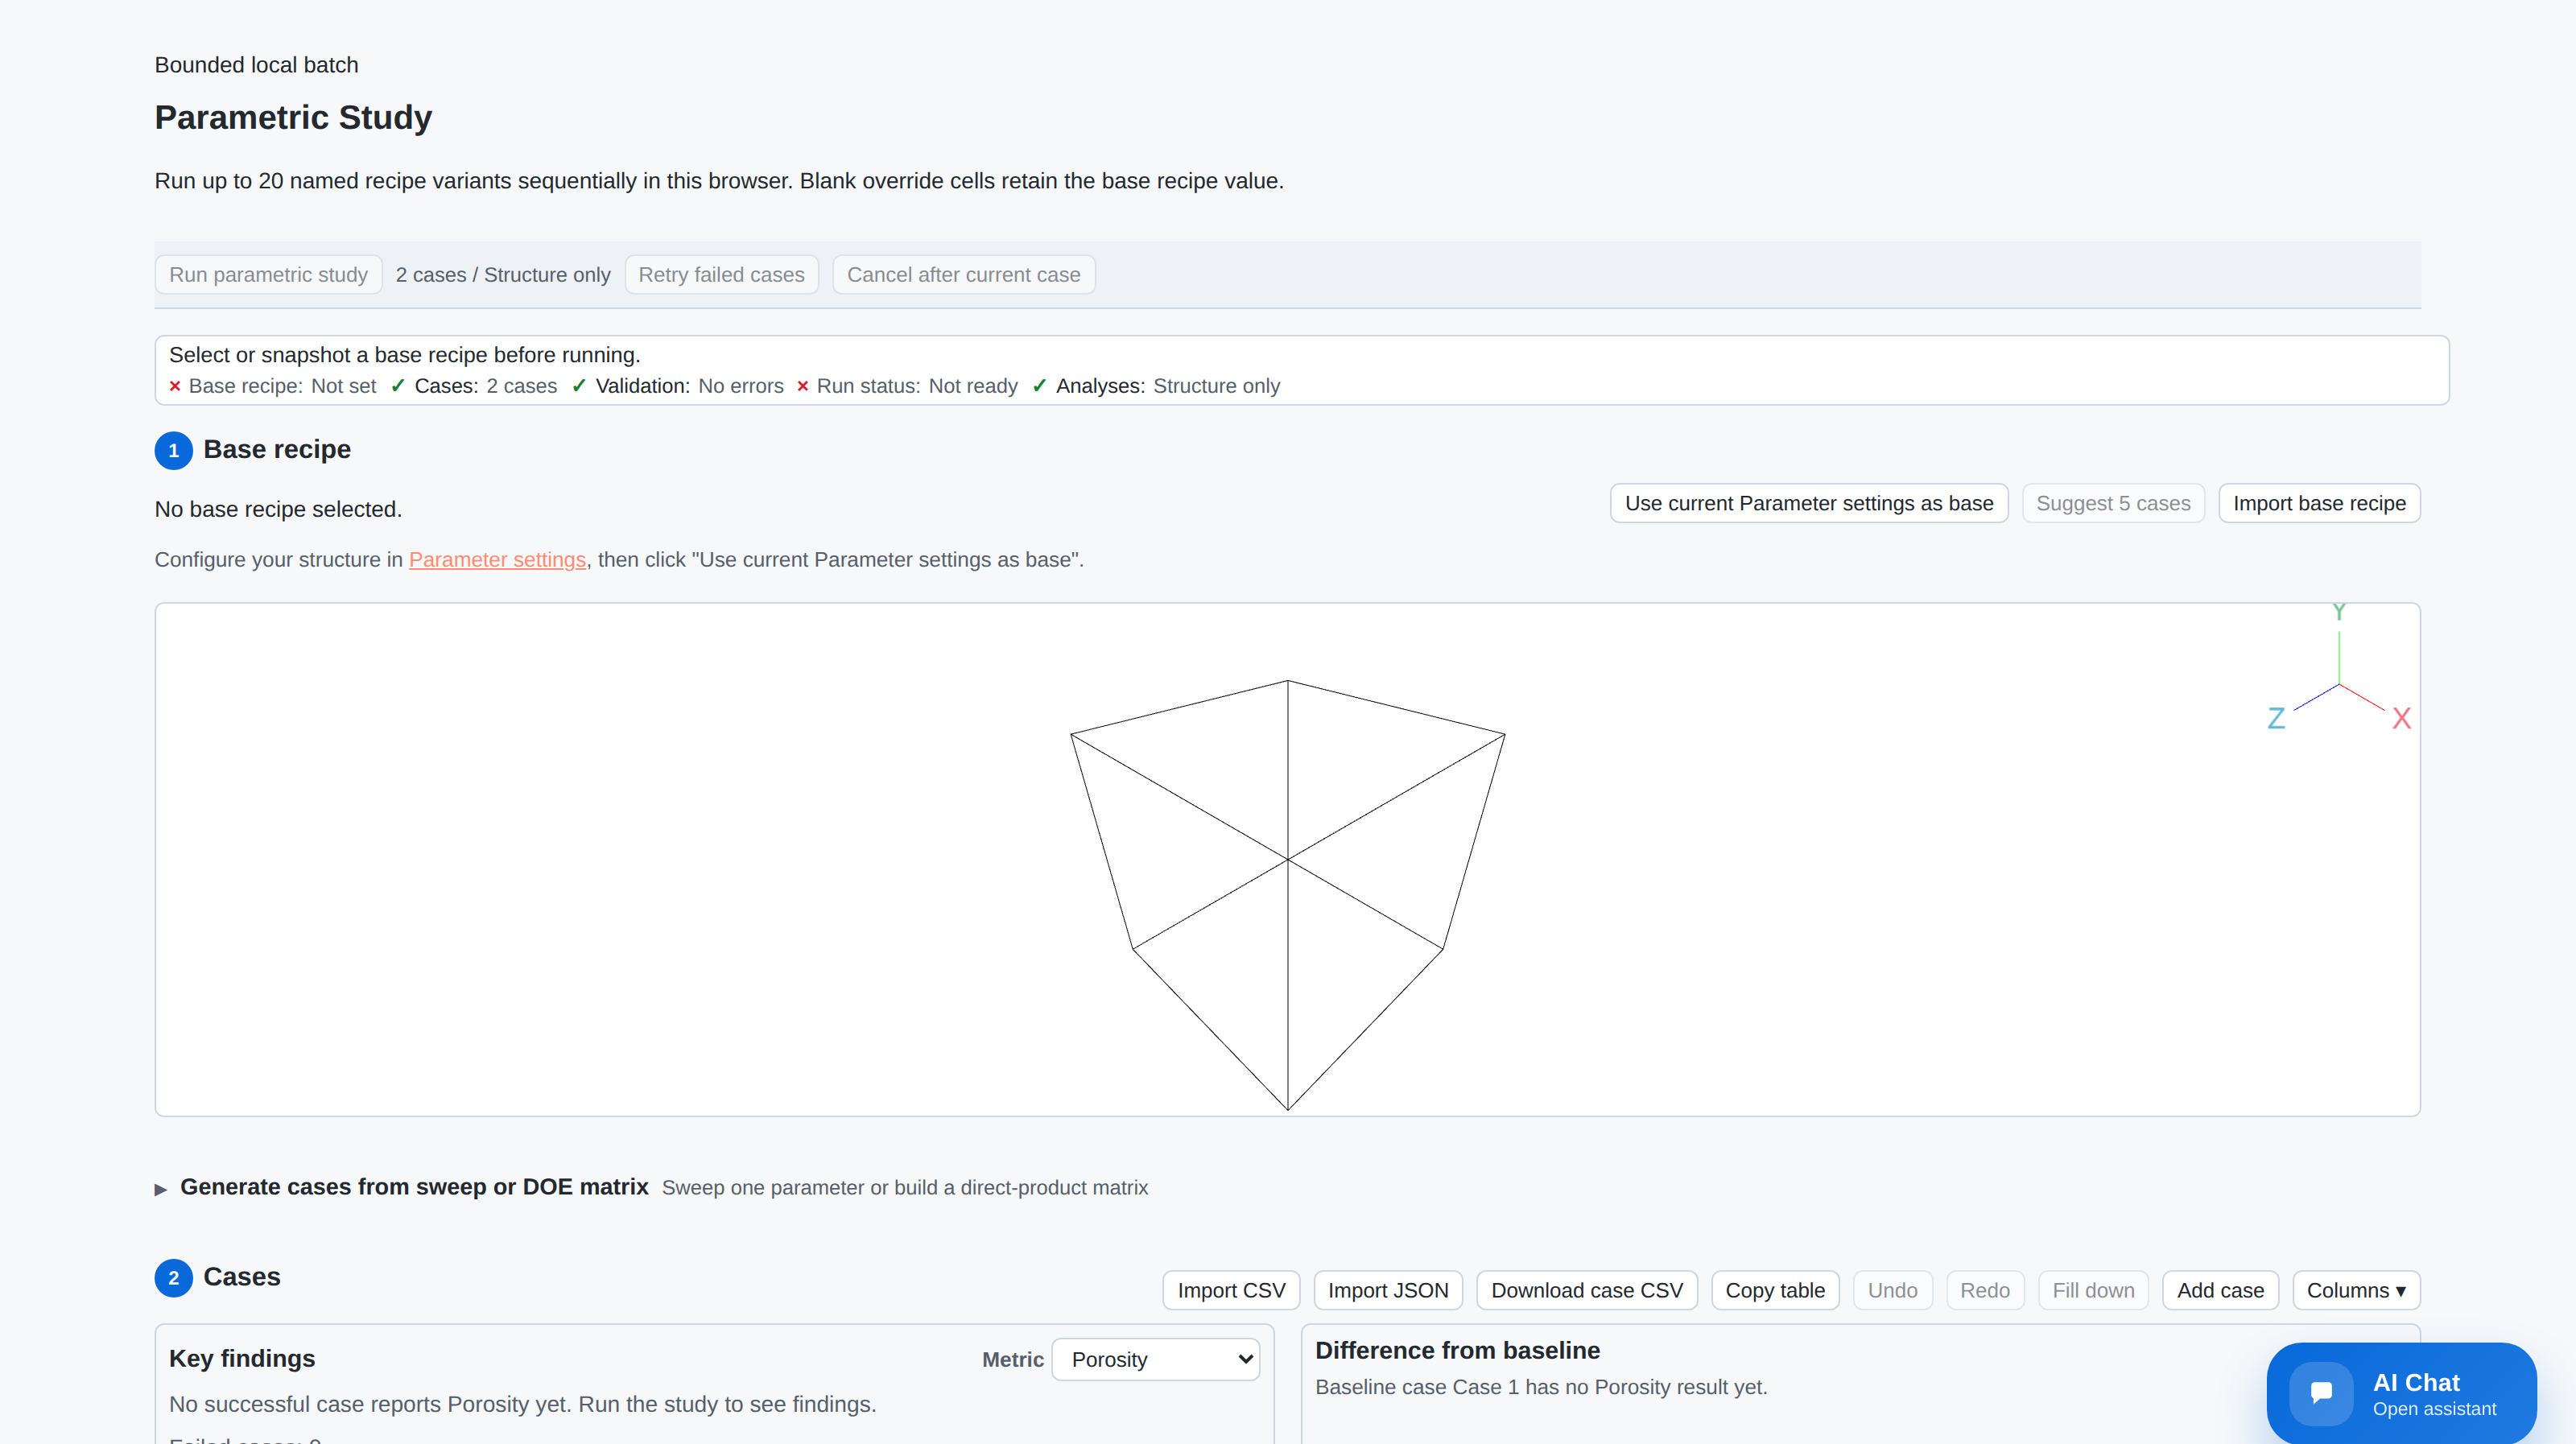
What you can do
Parametric Study takes one base recipe and a table of named cases. Each case overrides one or more parameters; every cell you leave blank inherits the base recipe value. The batch then runs the cases in sequence and collects the results side by side. The readiness row across the top of the workspace, above, states exactly what is still missing before a run can start.
- Up to 20 cases in one run.
- Sweepable parameters: seed, grid nx / ny / nz, voxel size, volume fraction, binder volume fraction, overlap percent, and the first filler config’s radius and length.
- Optional per-batch analyses: conductivity, permeability, diffusion, elasticity, invasion percolation, and CO2 adsorption.
- Export as JSON, CSV, or one .leS file per successful case.
Why it matters
Building twenty variants by hand is not just slow, it is inconsistent. Every rebuild is a chance to change a second parameter without noticing, and the comparison you end up with is only as trustworthy as your memory of what you typed. A batch fixes the base recipe once and records exactly which override each case carried.
It also makes the boring-but-necessary cases cheap. Re-running the same parameters under a different seed costs one extra row, so you can see how much of a trend is the parameter and how much is the random packing.
Example: how far does volume fraction move porosity
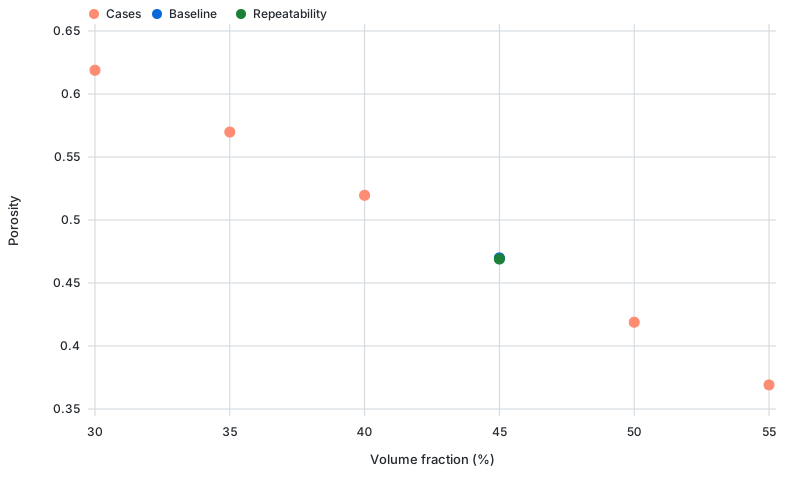
The sweep below is a 64³ particle packing, sphere filler of radius 5 voxels, run at six volume fractions from 30 % to 55 %, plus one repeat of the 45 % case under a different seed. Seven cases, one run.
| Case | Volume fraction | Porosity |
|---|---|---|
| vf-30 | 30 % | 0.6188 |
| vf-35 | 35 % | 0.5698 |
| vf-40 | 40 % | 0.5196 |
| vf-45 | 45 % | 0.4699 |
| vf-50 | 50 % | 0.4189 |
| vf-55 | 55 % | 0.3691 |
| vf-45 repeat (seed 777) | 45 % | 0.4690 |
Two things fall out of the run. The response is close to linear across this range, at roughly one point of porosity lost per point of volume fraction added. And the repeat case lands within 0.001 of the original 45 % case, so at this grid size the trend is the parameter rather than the seed.
Running one from the API
The same batch is available over HTTP. Rows carry dotted override paths, an optional purpose marks baseline and repeatability cases, and trendChart asks for the scatter plot as an SVG in the response.
POST /api/v1/parametric-study
{
  "study": {
    "baseRecipe": { "generatorType": "particlePacking", "grid": { ... }, ... },
    "rows": [
      { "name": "vf-30", "overrides": { "volumeFraction": 30 } },
      { "name": "vf-45", "overrides": { "volumeFraction": 45 }, "purpose": "baseline" },
      { "name": "vf-45 repeat", "overrides": { "volumeFraction": 45, "seed": 777 },
        "purpose": "repeatability" }
    ]
  },
  "trendChart": { "xKey": "volumeFraction", "yKey": "porosity" }
}
The response carries the per-case results plus a trendChart object holding the SVG, the axis labels, how many cases were plotted, and how many were skipped because they failed or had no value for that metric. The figure above is that SVG, unmodified.
When to use it
- You want a response curve rather than a single number.
- You need to separate a parameter effect from seed-to-seed scatter.
- You are handing someone a comparison and want the base recipe pinned and recorded.
It is a bounded local batch, not a job queue: 20 cases per run, executed in sequence. A cancelled run can be resumed for its pending cases, and a failed case does not stop the rows behind it.