What you can do
You can find out how many coating cycles your own structure survives before its pore space stops going anywhere. The coat is uniform. What it costs you is not, and the cost is a property of the structure you already have.
- POST /api/v1/morphology with operation: "dilate" adds one layer of solid to every exposed surface at once.
- POST /api/v1/metrics with includeTransportGraph: true returns porosity and whether the pore space still crosses the box along each axis.
- POST /api/v1/chord-length returns the pore chord distribution, which says which pore sizes went and which stayed.
- POST /api/v1/surface-area measures the interfacial area before you coat anything, and that one number predicts what the first step will cost.
- Feeding structureId through the chain keeps every number on the same voxels.
The run below is three structures, three seeds each, five coating steps each. It is about 230 API calls and finishes in a few minutes.
Why it matters
Coating a porous body adds roughly the same thickness everywhere. Atomic layer deposition on a catalyst support, a binder film on an electrode, early-stage sintering necks: all of them put material onto whatever surface is exposed.
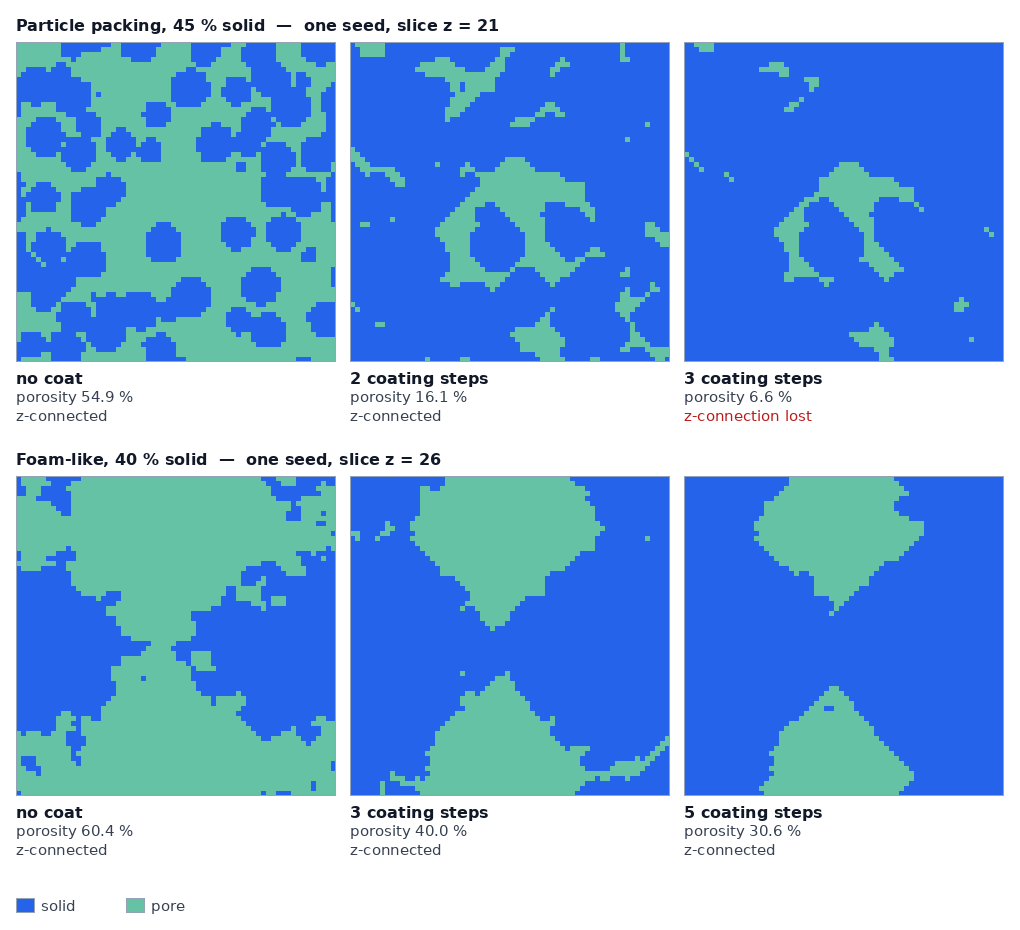
The pore space receiving that material is not uniform. Porosity records how much pore is left, not which pores went, so two structures reading the same porosity can be in very different shape. The packing and the foam below were both at 55.0 % porosity at one point in this run. The packing lost its path through the box within the next three or four steps. The foam still had one four steps later.
There is no way to reason this out from a spec sheet. It depends on how much surface the structure has and on how its pore widths are distributed, so it has to be measured on the structure you intend to coat.
What was run
Three structures, built from the API example recipes in a 64³ box at 1 µm per voxel.
- Particle packing at 45 % solid — 4 µm spheres, 15 % allowed overlap.
- Particle packing at 35 % solid — same recipe, less of it.
- Foam-like at 34 to 40 % solid — a thresholded noise field, no particles.
Each one was built on three seeds and then dilated one step at a time, up to five steps. After every step the same four measurements were taken from the same stored structure.
What one step costs, and how to know in advance
The first coating step cost the three structures 22.3, 19.1 and 8.0 points of porosity. The spread is almost three to one for an operation that treats every structure identically.
The interfacial area measured before coating predicts all three. Divide the porosity lost by the interfacial area per unit box volume and the answer lands between 0.84 and 0.88 µm for all three.
| Structure | Interface area per box volume (µm⁻¹) | Porosity before | After one step | Lost (points) | Lost ÷ area (µm) |
|---|---|---|---|---|---|
| Particle packing, 45 % solid | 0.261 | 55.0 % | 32.7 % | 22.3 | 0.85 |
| Particle packing, 35 % solid | 0.216 | 65.0 % | 45.9 % | 19.1 | 0.88 |
| Foam-like | 0.095 | 62.9 % | 55.0 % | 8.0 | 0.84 |
Every figure is the mean of three seeds. The seeds agreed closely: the last column varied by less than 0.01 µm within each structure.
That gives you a budget before you run anything. Measure the interfacial area of your structure, multiply by 0.85 µm, and you have the porosity your first voxel of coating will take. It is less than a full voxel because shells growing from facing surfaces run into each other in the narrow places.
Mean pore size went up while the pore space was being destroyed
In the foam, the mean pore chord along z rose from 7.79 µm to 9.28 µm over five steps. Porosity fell from 62.9 % to 32.8 % across the same five steps. Nothing got bigger. The small pores were removed, so the survivors are the large ones and the average followed them up.
The packings did the opposite. Their mean chord fell by 27 to 30 % on the first step and by about 69 % over five. All three seeds of all three structures moved the same way, with no overlap between the two behaviours.
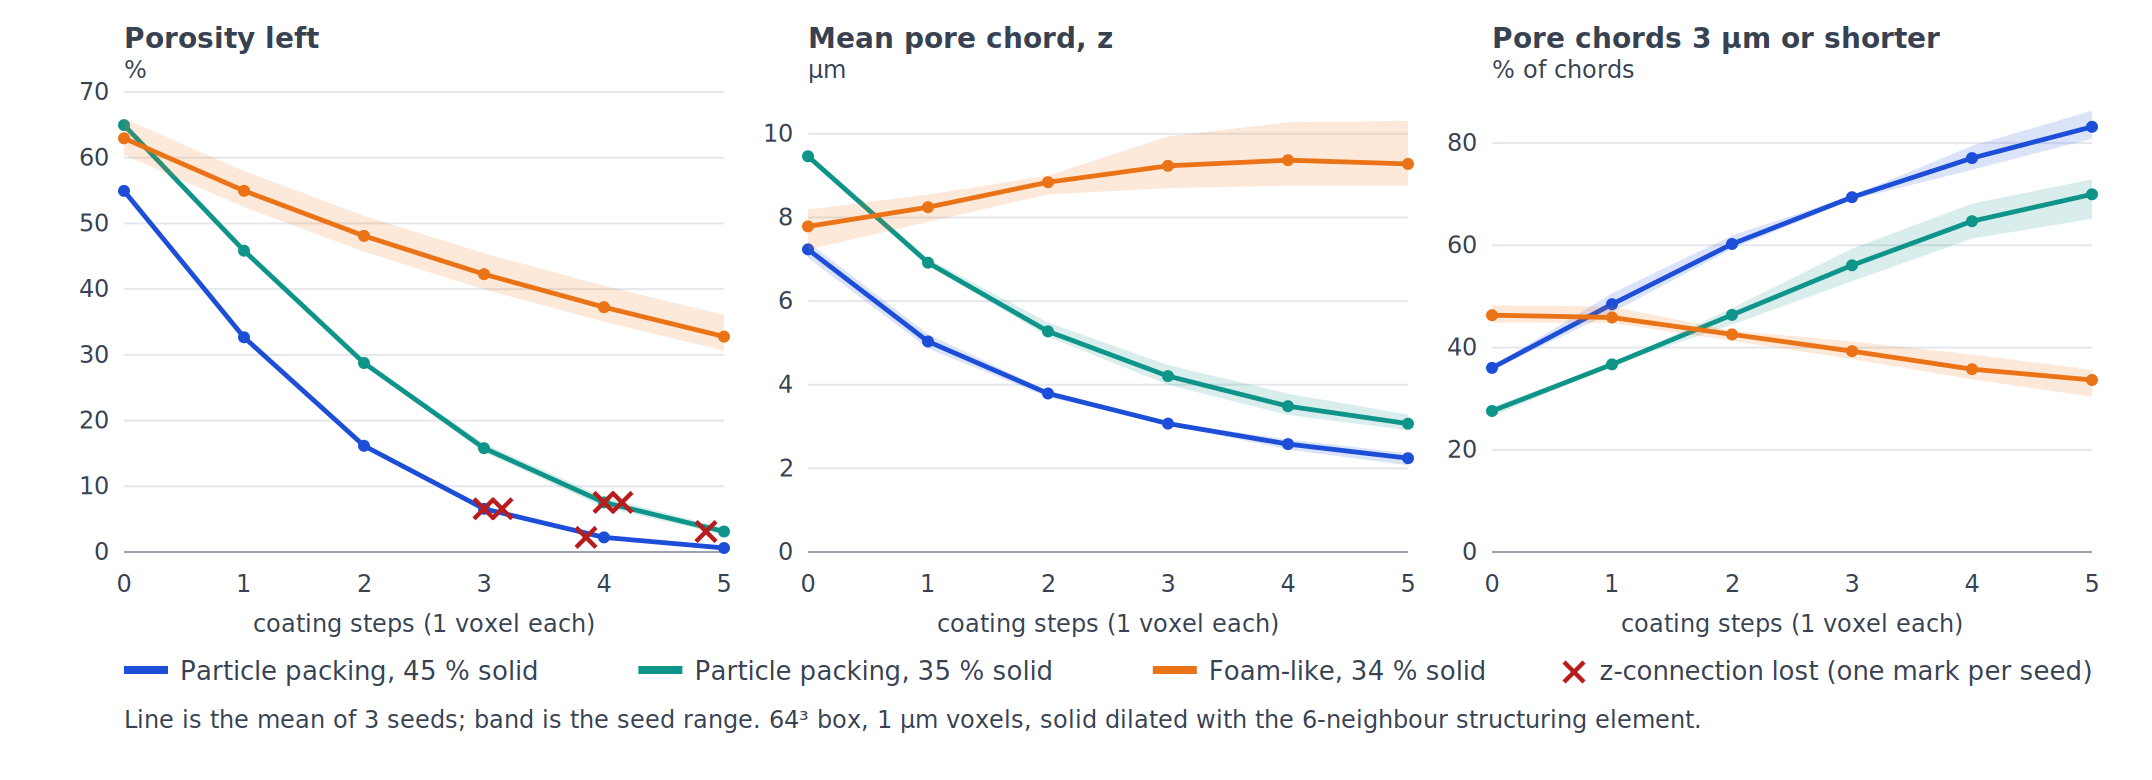
The chord distribution says which end of the population moved. Chords of 3 µm or shorter went from 36 % of the 45 % packing population up to 83 %, and from 46 % of the foam population down to 34 %.
Those two sentences describe different mechanisms. In the packing, the wide channels between particles narrow into thin ones and keep being counted, so the short bins fill up as the long bins empty. In the foam, the thin features disappear outright and the large cells stay large.
The practical consequence is that a mean pore size is not a progress bar for coating. It can move either way, and in the foam it moves in the direction that looks like good news.
Where the pore space stops going anywhere
The step at which the pore space stopped crossing the box along z was different for every structure, and porosity gave no warning that it was coming.
| Structure | Step that broke the z connection | Porosity one step earlier | Porosity after |
|---|---|---|---|
| Particle packing, 45 % solid | 3, 3, 4 (three seeds) | 6.6 to 16.1 % | 2.2 to 6.6 % |
| Particle packing, 35 % solid | 4, 4, 5 | 7.5 to 16.5 % | 3.1 to 8.3 % |
| Foam-like | never, within five steps | — | 30.6 to 36.1 % still connected |
Read the 45 % packing row again. One step before the break it still had up to 16.1 % porosity, which is not an alarming number. One step later there was no path through the box at all.
This is why the connectivity flag has to be measured at every step rather than interpolated between two of them. The transition happens inside a single step, and seeds of the same recipe do not all take it at the same step.
Porosity and the connectivity flag come out of the same metrics call. transportGraph.through.z counts the pore components that touch both z faces, so zero means the box no longer conducts through its pore space along that axis.
POST /api/v1/percolation-path was run as an independent check at the steps either side of each break. Its status field returned "solved" and "disconnected" in exactly the same places.
What the solid phase gets in exchange
The coat is not only a loss. It also welds the solid together, and the packing collects that benefit immediately.
With the solid set to 30 W/m·K, effective conductivity along z in the 45 % packing went from 19.6 to 25.0 W/m·K on the first step, then 27.5, 28.9, 29.6 and 30.1. The foam gained almost nothing on its first step, moving from 21.5 to 21.3, and only reached 27.4 after five. So the step that cost the packing 22.3 points of porosity bought it 28 % more conduction, and the step that cost the foam 8.0 points bought it nothing measurable.
Running this on your own structure
Start from a stored structure, whether generated or imported. The loop below is one coating step and the measurements that follow it.
POST /api/v1/surface-area
{ "structureId": "<id>", "materialId": 1, "method": "crofton13" }
-> surfaceArea.interfaceAreaUm2 / surfaceArea.voxelCount
   x 0.85 µm = porosity the first step will cost

POST /api/v1/morphology
{ "structureId": "<id>", "operation": "dilate",
  "materialId": 1, "radius": 1 }
-> structureId      the coated structure, stored for the next call

POST /api/v1/metrics
{ "structureId": "<coated id>", "includeTransportGraph": true }
-> metrics.porosity
-> transportGraph.through.z.throughComponentCount    0 = no path left
-> transportGraph.largestComponentFraction

POST /api/v1/chord-length
{ "structureId": "<coated id>" }
-> chordLength.phases.pore.z.meanLengthUm
-> chordLength.phases.pore.z.histogram- Feed the structureId returned by morphology into the next step. Chaining single steps gives the same result as one call with a larger radius, and you get to measure in between.
- Run at least three seeds of your recipe. Two of the three 45 % packing seeds broke a full step before the third.
- Keep the transport graph part at 64³ voxels or below, which is where that summary is capped.
- Stop the sweep when through.z reaches zero. Everything past that point is pore space that no longer connects to anything.
What this does not settle
A dilation step is a geometric coat, not a deposition model. It puts the same thickness on every exposed surface, including surfaces that a real precursor would struggle to reach. A real process starves the interior of deep pores and would close the outside first.
One voxel is a coarse increment. At 1 µm per voxel these steps are thick coats, and a few-nanometre film would need a finer grid to resolve at all. The useful output here is the shape of the curve and the step where connectivity goes, not the absolute thickness.
Chords that touch a box face are not counted, so the distribution describes interior chords. Conductivity was measured along z only, on the solid phase, with one method.