What you can do
You can find out, for your own structure, how much resolution each quantity you care about actually needs — by measuring it rather than by picking a rule of thumb. Register a structure once, coarsen it through the API, and run the identical analysis request against every level. What comes back is one table of how far each number moved.
- POST /api/v1/coarsen takes a stored structureId and a factor of 2, 3, 4, 6 or 8 and returns a new structureId, so a resolution ladder is one request per rung.
- The coarse structure keeps the same physical extent: the grid halves and voxelSizeUm doubles, so values in µm stay directly comparable.
- The analysis endpoints take a structureId too, so the same request body runs against every rung with one field changed.
- Server-side coarsening took 77 ms for 262,144 voxels and 2 ms for the next rung — the ladder itself is not what costs you anything.
Why it matters
Anyone holding a CT or FIB-SEM volume has the same standing temptation: the data is heavy, re-imaging is expensive, and downsampling makes everything downstream cheaper. The open question is never whether coarsening is faster — it is which of the numbers you then quote are still about your material and which are now about your voxel. That has no general answer, because it depends on the pore sizes in front of you. It does have a cheap empirical one.
One structure, three resolutions
The starting structure is the particle-packing example from GET /api/v1/examples: 4 µm spheres on a 1 µm grid, 64³, filler raised to 45 % by volume at 15 % overlap, seed fixed. It came back at 45.03 % solid — 118,037 of 262,144 voxels. Coarsening it by 2 gives 32³ at 2 µm per voxel; coarsening that again gives 16³ at 4 µm. All three describe the same 64 µm cube. A sphere that was eight voxels across at the top of the ladder is two voxels across at the bottom.
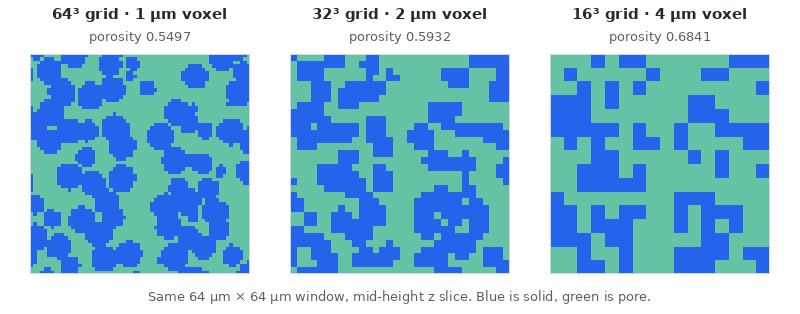
The picture already says what the table will. At 1 µm, 14.2 % of the pore chords along x are a single voxel long — 2,194 of 15,440. Those are the necks, and at 4 µm they cannot exist, because the shortest representable chord is 4 µm. They do not get coarser; they get deleted, and what they connected is either merged into one blob or cut apart.
The ranking is the result
Five analyses ran against each rung with identical request bodies: metrics, surface area, chord length, effective conductivity along z by the graph-network method, and permeability along z by the pore-network method. Every call returned 200.
| Quantity | 64³ · 1 µm | 32³ · 2 µm | 16³ · 4 µm | at 2× | at 4× |
|---|---|---|---|---|---|
| Tortuosity, z | 1.0317 | 1.0323 | 1.0000 | +0.05 % | −3.1 % |
| Specific surface area (µm⁻¹) | 0.6881 | 0.6426 | 0.5632 | −6.6 % | −18.1 % |
| Porosity | 0.5497 | 0.5932 | 0.6841 | +7.9 % | +24.4 % |
| Effective conductivity, z | 4.458 | 3.860 | 3.025 | −13.4 % | −32.1 % |
| Solid–pore interface area (µm²) | 68,941 | 57,820 | 38,596 | −16.1 % | −44.0 % |
| Mean pore chord, x (µm) | 7.04 | 8.88 | 12.21 | +26.2 % | +73.6 % |
| Permeability, z (µm²) | 0.2777 | 1.3364 | 7.2372 | +381 % | +2,506 % |
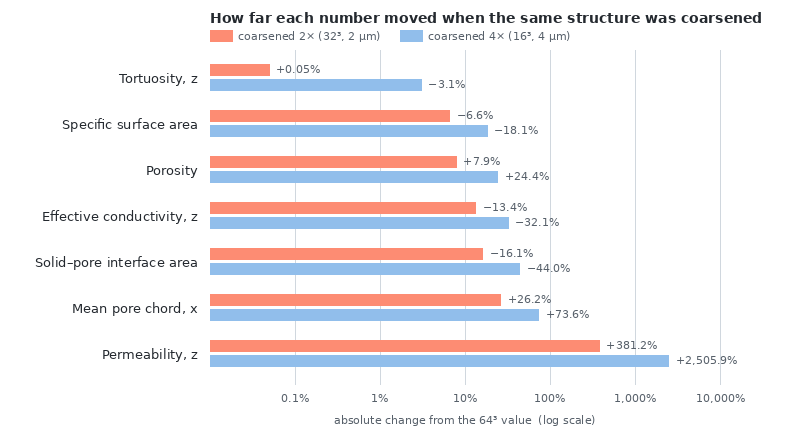
Read it as an ordering rather than as a set of tolerances. Tortuosity is a ratio of two path lengths across the same box, so it barely moved; at 16³ it hit exactly 1.000 in all three directions, which is less a measurement than a grid with too few cells to bend a path through. Specific surface area survives better than it deserves to, for a reason worth naming: it is an area over a phase volume, and coarsening shrank both. The interface area alone fell 16.1 % at 2× and 44.0 % at 4×. Quote the ratio and you will believe the damage is a third of what it is.
Porosity was not free
The bulk volume fraction is the number most people assume rides through a downsample untouched. It did not. The solid went 45.03 % → 40.68 % → 31.59 %, and the drift has one direction. Coarsening here is a block majority vote, and a tied block is not a coin flip. Sending a 4³ structure with blocks of known composition and coarsening it by 2 shows the rule directly:
| Solid voxels in the 2×2×2 block | 8 | 5 | 4 | 3 | 1 | 0 |
|---|---|---|---|---|---|---|
| Resulting coarse voxel | solid | solid | pore | pore | pore | pore |
Four out of eight becomes pore. That test structure went in at 51.6 % solid and came out at 37.5 %. On a real packing the effect is milder, because the phases are clustered rather than interleaved, but it always points the same way and it compounds — and it eats the solid from wherever the solid is thinnest.
That is also why conductivity fell while porosity rose: one erosion, seen from opposite phases. The solid went from 43 connected components to 28 at 2×, then back up to 61 at 4× while losing 30 % of its volume — first the thin bridges thicken and merge, then the network falls apart into islands. If your calculation needs a percolating solid, conduction or stiffness, that second stage is where it stops being your material.
Permeability became the voxel size
The bottom row of the table is the one to take away. Permeability rose by a factor of 4.81 at the first rung and 5.42 at the second — 0.2777 µm² to 1.3364 to 7.2372. Note the units the API returns it in. Permeability is an area, and the voxel face area quadrupled at each step. A quantity that scales with the square of the smallest length you can represent will report, near enough, the length you chose.
Nothing warned about this. The pore space percolated in x, y and z at every rung, so every call returned 200; the solver simply found channels that had grown from 1 µm to 4 µm wide and answered honestly about them. A batch that coarsens for speed and then reports permeability gets clean responses all the way down and numbers wrong by an order of magnitude.
Running it on your own structure
Three requests build the ladder, then the same analysis body runs against each structureId in turn.
POST /api/v1/generate          -> structureId A   (64^3, voxelSizeUm 1)
{ "recipe": { ... }, "storeStructure": true }

POST /api/v1/coarsen           -> structureId B   (32^3, voxelSizeUm 2)
{ "structureId": "<A>", "factor": 2 }

POST /api/v1/coarsen           -> structureId C   (16^3, voxelSizeUm 4)
{ "structureId": "<B>", "factor": 2 }

POST /api/v1/permeability      -- same body for A, B and C
{
  "structureId": "<A>",
  "request": {
    "version": "phase0.v1",
    "analysisType": "permeability",
    "inputs": { "grid": { "nx": 64, "ny": 64, "nz": 64, "voxelSizeUm": 1 },
                "materialProperties": { "1": 7 } },
    "params": { "direction": "z", "method": "pore-network", "poreMaterialIds": [0] },
    "requestedOutputs": ["summary"]
  }
}
Coarsening accepts factors of 2, 3, 4, 6 and 8, and the grid has to divide evenly by the factor — 64 → 32 → 16 works, 50 → 25 → nothing does. Stored structures carry an expiry, so build the ladder and run the analyses in one session rather than coming back to the ids tomorrow. Here is what the coarse grids bought, as round-trip time measured from outside:
| Call | 64³ | 32³ | 16³ |
|---|---|---|---|
| POST /api/v1/metrics | 884 ms | 247 ms | 219 ms |
| POST /api/v1/surface-area | 292 ms | 253 ms | 206 ms |
| POST /api/v1/chord-length | 253 ms | 196 ms | 227 ms |
| POST /api/v1/conductivity | 1,206 ms | 268 ms | 253 ms |
| POST /api/v1/permeability | 401 ms | 224 ms | 198 ms |
| All five | 3,036 ms | 1,188 ms | 1,103 ms |
At this size, coarsening is not worth doing for speed. The first rung saved 1.8 seconds; the second saved 85 ms, because at 16³ almost all of the time is the network round trip rather than the solver. Coarsening earns its keep on volumes far larger than this one — and the ladder is worth running on a small structure first precisely because it costs seconds to learn which columns would survive the trip.
What this does not settle
One packing, one seed, one loading. A 4 µm sphere on a 1 µm grid is already a marginally resolved particle, so this ladder starts closer to its own limit than a well-sampled CT volume would, and a structure whose features span twenty voxels will ride the first rung far better. What transfers is not the percentages but the shape of the list — bulk ratios at the top, anything depending on the narrowest passage at the bottom.
The comparison is also against the 64³ result, not against the truth. The finest grid here is a reference, not a converged answer, and its own permeability is subject to the same argument one rung further up. Reading the table as "what would I lose by coarsening" is fair; reading it as "how much error do I have" is not.