What you can do
You can find out how much filler your formulation needs before anyone weighs a powder. Conductive and thermally conductive fillers are expensive, and loading is also what decides whether the compound is still processable. The loading where the filler phase first connects is the number that sets both.
- One POST /api/v1/parametric-study sweeps up to 20 loadings from a single base recipe.
- Ask the study for conductivity and every case is generated and analyzed in the same call.
- A case that returns exactly 0 has no connected filler path in that direction, so the sweep locates the threshold without any extra measurement.
- Repeating the sweep on several seeds turns a threshold into a band, which is what it actually is.
- The same sweep, pushed higher, finds where the generator refuses to pack any more in.
A sweep of eight loadings took between 3.6 and 6.0 seconds. Running five seeds of three shapes was fifteen requests.
Why it matters
Shape is the cheapest lever in a filler spec, and it is usually chosen last. Aspect ratio is known to move the percolation threshold. But the published numbers are for idealised rods and discs, not for the filler you can buy at a size you can disperse.
Measuring it on your own dimensions takes minutes here, and the answer is worth having early. A shape that connects at 10 % instead of 30 % changes the cost and the viscosity of everything downstream.
The sweep
Three stock recipes from GET /api/v1/examples were used unchanged apart from the box and the loading. Each was scaled to a 64³ grid at 1 µm per voxel and given a fixed seed. Loading went from 5 % to 40 % in steps of 5.
- Spheres — particle-packing, radius 4 µm.
- Fibers — fiber-packing, radius 2 µm and length 28 µm, randomly oriented.
- Platelets — platelet-packing, radius 7 µm and thickness 2 µm, randomly oriented.
Everything else was held identical. Fillers may overlap by 15 %, the filler carries 30 W/mK from the ceramic alumina preset, and the rest of the box is void. Conductivity was measured along z with the graph-network method.
The generator hit every loading it was asked for. Across all 120 structures the worst miss between the requested loading and the solid fraction that came back was 0.13 percentage points. No result below is a shape that quietly got more material than another.
Three shapes, three thresholds
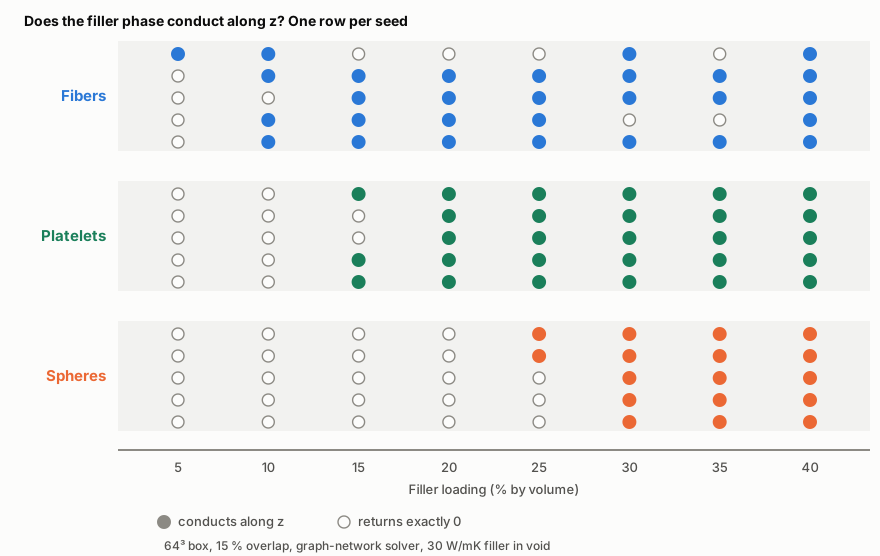
The fibers connect at a third of the loading the spheres need, and the platelets sit between them. Five seeds per shape never put the three groups in a different order.
| Shape | First loading that conducted, five seeds | Median |
|---|---|---|
| Fibers | 5 %, 10 %, 10 %, 10 %, 15 % | 10 % |
| Platelets | 15 %, 15 %, 15 %, 20 %, 20 % | 15 % |
| Spheres | 25 %, 25 %, 30 %, 30 %, 30 % | 30 % |
The gap is large enough to survive the seed scatter. No fiber seed needed more than 15 %, and no sphere seed managed less than 25 %. Shape alone moves the required loading by 20 percentage points.
The shapes are far closer together once they are all well past their thresholds. At 40 % loading the five seeds gave fibers 20.2 to 20.6 W/mK, platelets 21.1 to 22.4, and spheres 16.6 to 18.2. Spheres are still last, but by a quarter rather than by a factor of three.
So shape mostly decides where the curve starts, not where it ends. What it buys you is spent at low loading, which is exactly where you want to be.
The first connection is not the same for every shape
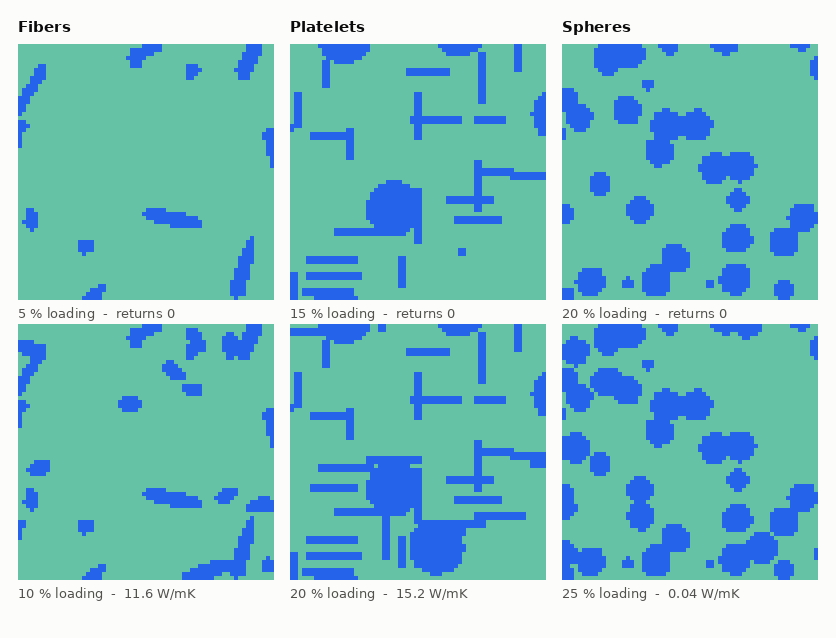
Spheres cross their threshold by a thread. Platelets cross it by a wide margin. The value each shape returns at its own first non-zero loading says so directly.
| Shape | Reading at the first loading that conducted, five seeds (W/mK) |
|---|---|
| Fibers | 0.07, 3.8, 4.4, 9.0, 11.6 |
| Platelets | 12.7, 13.7, 14.0, 15.2, 16.4 |
| Spheres | 0.04, 0.11, 0.45, 2.4, 10.6 |
Four of the five sphere seeds first read 2.4 W/mK or less, against a filler that carries 30. That first path is one chain of touching particles and it carries almost nothing. Platelets never do this: every platelet seed arrives above 12 W/mK on the first loading that works at all.
This matters when you pick a target. Loading a sphere filler to exactly its percolation threshold buys you a connected network with no useful conductivity. With platelets the threshold and the working loading are the same number.
The fibers do not answer the same way twice
Two of the five fiber seeds stopped conducting again at higher loading. No sphere or platelet seed ever did. Once those two shapes connected, they stayed connected at every loading above.
- Seed 20260913 conducted at 5 % and 10 %, read zero at 15 %, 20 % and 25 %, conducted at 30 %, read zero at 35 %, then conducted at 40 %.
- Seed 20260916 conducted from 10 % through 25 %, then read zero at 30 % and 35 %, then conducted at 40 %.
- The other three fiber seeds rose normally once they started.
The flicker is not solver noise. The seed 20260913 sweep was run twice, and the two runs produced identical solid fractions and the same pattern of zeros. Their conductivities matched to within 0.005 %.
Each loading is a genuinely different fiber arrangement, not a denser version of the one below it. At 28 µm in a 64 µm box, a handful of fibers decides whether anything spans.
The practical reading is that one seed is not an answer for a high aspect ratio filler. Five seeds put the fiber threshold at 10 % with confidence. One seed could have told you 5 %, or told you the material stops working at 35 %.
The other line: how much fits at all
The same sweep pushed past 40 % finds the upper end. Spheres and platelets both reached 60 % and both refused at 65 %, with a failed case rather than a failed request.
| Shape | 55 % | 60 % | 65 % |
|---|---|---|---|
| Spheres | built | built, 23.4 W/mK | refused: placed 169,318 of 170,393 voxels |
| Platelets | built | built, 25.1 W/mK | refused: placed 163,584 of 170,393 voxels |
| Fibers | built, 10.5 s | request timed out | request timed out |
A study isolates its failures. The 65 % cases came back as failed rows carrying packing_target_unattainable and the message quoted above. The rest of the study still returned its results, so one call gives you the ceiling and the data below it.
The fiber ceiling in that table is a different thing, and worth being clear about. A single 55 % fiber structure took 10.5 seconds to generate. At 60 % and 65 % the request returned 504 after about 15 seconds.
That is the request budget running out, not the generator saying the packing is impossible. Where fibers stop packing is not something this run measured.
Running it on your own filler
One study per shape. The generator type lives in the base recipe and a row cannot override it. Comparing shapes therefore means separate studies, with everything else held equal.
POST /api/v1/parametric-study
{
  "study": {
    "name": "platelets: volume fraction sweep",
    "baseRecipe": {
      "generatorType": "plateletPacking",
      "grid": { "nx": 64, "ny": 64, "nz": 64, "voxelSizeUm": 1 },
      "fillerConfigs": [
        { "type": "platelet", "radius": 7, "thickness": 2, "volumeFraction": 5, "materialId": 1 }
      ],
      "overlapPercent": 15,
      "randomness": { "seed": 20260914 }
    },
    "rows": [
      { "name": "vf-5",  "overrides": { "volumeFraction": 5 } },
      { "name": "vf-10", "overrides": { "volumeFraction": 10 } }
    ],
    "conductivity": {
      "materialProperties": { "1": 30 },
      "method": "graph-network",
      "directions": ["z"]
    }
  },
  "includeLeS": false,
  "trendChart": { "xKey": "volumeFraction", "yKey": "conductivity.z" }
}

-> cases[].conductivity.directions.z.value
-> trendChart.svg
Two details are worth knowing before you run it. Loading is held in several places in a recipe, so set it through the row override and let the server rewrite them together. And raise overlapPercent with the loading, or the generator refuses to pack long before you reach the interesting range.
The study also draws the sweep. Ask for trendChart with yKey conductivity.z and the response carries a finished SVG.
All three sweeps reported a point count of 8 and a skipped count of 0. A case that reads zero still gets plotted, which is what you want here, because the zeros are the answer.
What this does not settle
This is one box size, one overlap setting, one filler dimension per shape and five seeds. The three shapes differ in size as well as in form, because the stock recipes were left at their own dimensions. Reading it as pure shape would be reading more into it than the run supports.
The step size also limits the resolution. A threshold reported as 10 % only means the first measured loading that conducted, somewhere above 5 %. Narrow it by adding rows, since a study takes 20 of them.
All conductivities come from the graph-network method, which reduces the structure to a network before solving. It is the right tool for a sweep of this size. A threshold you intend to act on deserves a check on the full grid at the few loadings that matter.