What you can do
You can work out how many cross sections your own material needs before you quote a number from them. Build a structure that resembles yours, measure it in 3D, then cut it into sections and compare.
- POST /api/v1/generate with storeStructure builds the structure once and keeps it server-side for the rest of the run.
- POST /api/v1/metrics returns the 3D volume fraction and the area fraction of every z section in the same response.
- POST /api/v1/crop accepts a region one voxel thick, so a section comes back as a structure you can analyse like any other.
- POST /api/v1/chord-length reports the pore phase and the solid phase separately, along each axis.
The answer is per quantity, not per material. Running this once on a structure like yours tells you how many images each of your reported numbers actually needs.
Why it matters
Most labs have polished sections, not tomograms. A few images get measured, averaged, and reported as if they described the block they came from.
There is current interest in putting an uncertainty on that number instead of just averaging. This article covers the practical half of the question: how many sections, for which quantity.
Averaging more images is cheap to say and expensive to do. Knowing that one number needs six sections and another needs fifty-four changes what you choose to report.
The structures, and how they were sliced
Two recipes from GET /api/v1/examples were built at 64³ with 1 µm voxels. Particle packing was raised to 40 % solid. Fiber packing was raised to 20 % with every fiber aligned on z.
Each structure was measured in 3D first, so there is a known answer to compare against. It was then cut into sections one voxel thick, and each section was measured on its own.
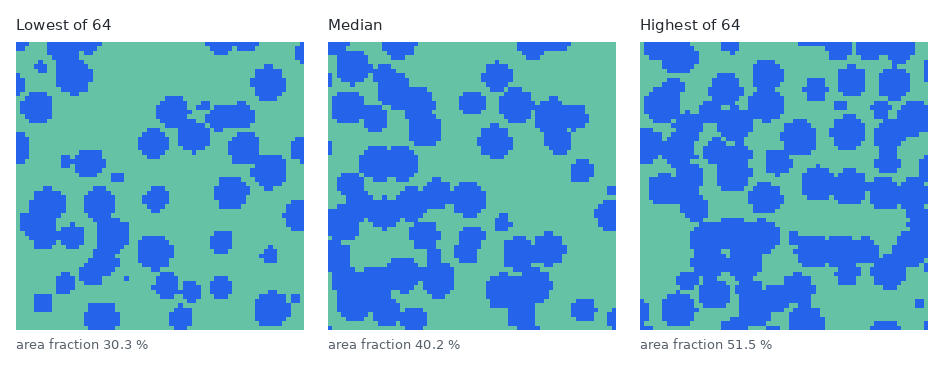
A one-voxel crop is accepted, and what comes back is exact. The area fraction measured on a cropped section matched the value in the parent structure's sliceFractions array bit for bit, at all four indices checked.
Averaging the sections lands on the 3D answer
Every quantity came back unbiased within the precision available. Pooling the 32 measured sections of each seed 2001 structure reproduced the 3D value to within 1.7 %.
| Structure and quantity | 3D value | Average of the sections | Offset |
|---|---|---|---|
| Particle packing, area fraction | 40.02 % | 40.02 % | 0.00 % |
| Particle packing, solid chord | 6.417 µm | 6.407 µm | −0.16 % |
| Particle packing, pore chord | 8.416 µm | 8.558 µm | +1.69 % |
| Fiber packing, area fraction | 20.05 % | 20.05 % | 0.00 % |
| Fiber packing, solid chord | 3.562 µm | 3.559 µm | −0.10 % |
| Fiber packing, pore chord | 10.433 µm | 10.544 µm | +1.07 % |
The two area fraction rows are arithmetic rather than evidence. Every voxel belongs to exactly one section, so the 64 section fractions have to average to the volume fraction.
The chord rows are not arithmetic. A chord measured inside a plane is a different measurement from a chord measured through a volume, and nothing forces the two to agree. They agreed to better than 2 %.
What changes is how many sections it takes
The number of sections you need changes by a factor of nine between quantities. The chart counts sections until 95 % of averages land within 5 % of the 3D answer.
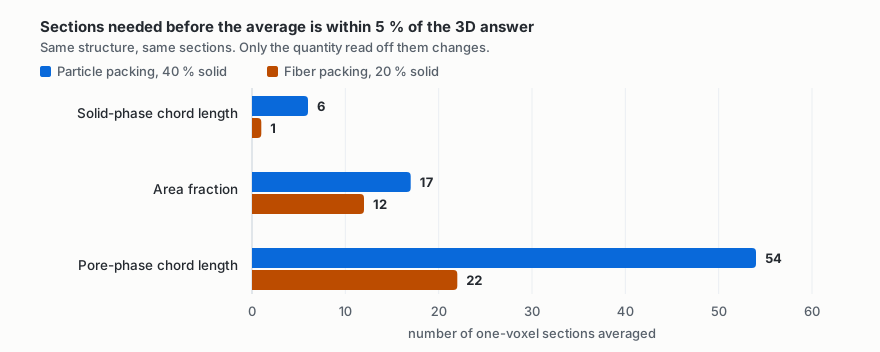
The solid phase is the cheapest number on the image. One section put the fiber structure's transverse solid chord within 5 % of the 3D value. Across 32 sections it ranged only from 3.40 to 3.65 µm.
The pore phase is the most expensive, and it costs more than the area fraction people read off instead. The reason is visible in the structures themselves.
- The solid phase is particles and fibers at a size the recipe controls, so every section cuts a similar population.
- The pore phase is one connected space whose chords run from a single voxel to sixty, and a section catches a different part of that range each time.
- The area fraction sits between them because it counts voxels rather than features, but it still swings 21 points across the particle packing's 64 sections.
The count is a property of the structure, not only of the recipe. Two seeds of the particle recipe both needed 17 sections. Two seeds of the fiber recipe needed 12 and 29.
| Structure | 3D solid | Range across 64 sections | Sections for ±5 % |
|---|---|---|---|
| Particle packing, seed 2001 | 40.02 % | 30.3 – 51.5 % | 17 |
| Particle packing, seed 2002 | 40.05 % | 30.2 – 48.5 % | 17 |
| Fiber packing, seed 2001 | 20.05 % | 16.6 – 23.4 % | 12 |
| Fiber packing, seed 2002 | 20.03 % | 14.9 – 23.9 % | 29 |
The third axis is missing, and thickness does not recover it
The chord along the section normal is not reported at all. On a one-voxel section, chord-length returns the z axis with a chordCount of 0 and a null mean.
That is the right behaviour. The quantity exists in the structure, the section has no access to it, and the response says so rather than guessing.
Cutting a thicker slab does not fix it. At every thickness tried, the longest z chord that came back was the thickness minus two voxels. That is what you get when chords touching either face are dropped.
The particle structure's true solid chord along z is 6.309 µm. No slab got close.
| Slab thickness | Longest z chord it can return | Mean z chord reported |
|---|---|---|
| 1 voxel | none | none |
| 2 voxels | none | none |
| 4 voxels | 2 µm | 1.36 µm |
| 8 voxels | 6 µm | 3.59 µm |
| 16 voxels | 14 µm | 5.12 µm |
A 16-voxel slab is a quarter of the whole box and still read 19 % short.
The aligned fiber structure is worse. Its fibers run 28.6 µm along z, so no slab up to 16 voxels held a complete one, and every thickness returned nothing at all.
In-plane chords were untouched by thickness. Across all ten slabs the in-plane solid chord stayed between 6.30 and 6.62 µm. Thickening a section buys you nothing in plane and cannot buy you the normal direction.
For an oriented material, the cut direction decides the cost
Polishing direction changes how many sections an anisotropic material needs. The same fiber structure was cut both ways.
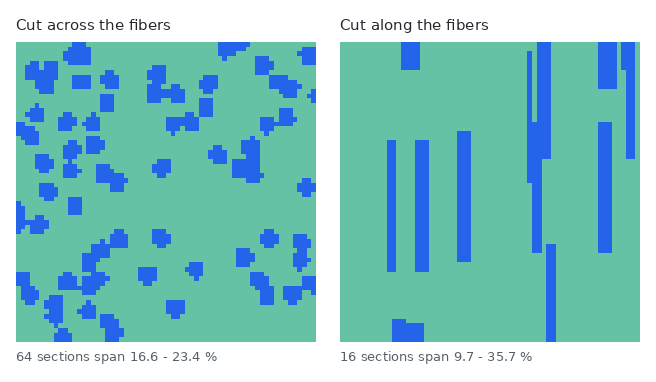
Cutting across the fibers gave area fractions from 16.6 to 23.4 %, a standard deviation of 1.8 points. Cutting along them gave 9.7 to 35.7 %, a standard deviation of 6.9 points. Both sets still average onto the solid fraction the structure holds, at 20.05 % and 20.21 %.
Cutting along the fibers is the only way to see their length. Those sections returned an in-plane solid chord of 28.0 to 30.0 µm along z, bracketing the 28.6 µm the structure actually holds. Sections cut across the fibers cannot reach it.
So the two cuts are complementary rather than ranked. The transverse cut measures the volume fraction and the fiber diameter cheaply. The longitudinal cut is the only one that measures the length.
Running it on your own recipe
Four calls set up the comparison, and one of them does most of the work.
POST /api/v1/generate        -> structureId
{ "recipe": { ... }, "storeStructure": true }

POST /api/v1/metrics         -- the 3D answer AND every section's area fraction
{ "structureId": "<id>" }
  -> metrics.volumeFractions        the 3D value
  -> metrics.sliceFractions         one area fraction per z section

POST /api/v1/chord-length    -- the 3D chords, per phase, per axis
{ "structureId": "<id>" }

POST /api/v1/crop            -- one section, as a structure of its own
{
  "structureId": "<id>",
  "region": { "originX": 0, "originY": 0, "originZ": 12,
              "sizeX": 64, "sizeY": 64, "sizeZ": 1 }
}
  -> feed the returned structure back to /api/v1/chord-length
The metrics response already carries a sliceFractions array holding the area fraction of every z section. One call at 688 ms returned all 64 values for the particle structure.
Cropping and measuring the sections one at a time gives the identical numbers and costs 192 requests. A token is capped at 60 requests a minute, and the next one comes back 429 rate_limited, so the same information takes over three minutes. Use crop when you want the chords, which sliceFractions does not carry.
What this does not settle
These are one-voxel digital sections of a generated structure, not polished surfaces. A real section carries preparation damage, a finite depth of field and a segmentation step. All three add scatter that this comparison does not contain.
The section counts belong to these four structures at 64³ with 1 µm voxels. The ranking held in all four. The numbers did not, since the two fiber seeds disagreed by more than a factor of two.
Both chord figures rest on 32 sections per structure, so an offset smaller than about 2 % is not resolved here. The section counts are bootstrapped with replacement, which treats sections as independent.
Neighbouring sections are not independent, and the penalty is measurable. Eight consecutive sections of the particle packing put the area fraction within 10.8 % of the 3D value, where eight scattered ones managed 7.0 %. Spread your images out across the sample.